Does your company want to reduce its carbon footprint? Or perhaps even become carbon neutral? Then you need to know where you stand to begin with. In other words, measure your company’s CO2 emissions. Many companies struggle with this. Because where do we start? And how do you actually measure the total amount of CO2 a company produces?
The short answer: just start. Becoming more sustainable is not a matter of thinking, but of doing. And it really is easier than you think. In this article we give you tools to determine and reduce the carbon footprint of your company step by step.
Calculating carbon footprint: three scopes
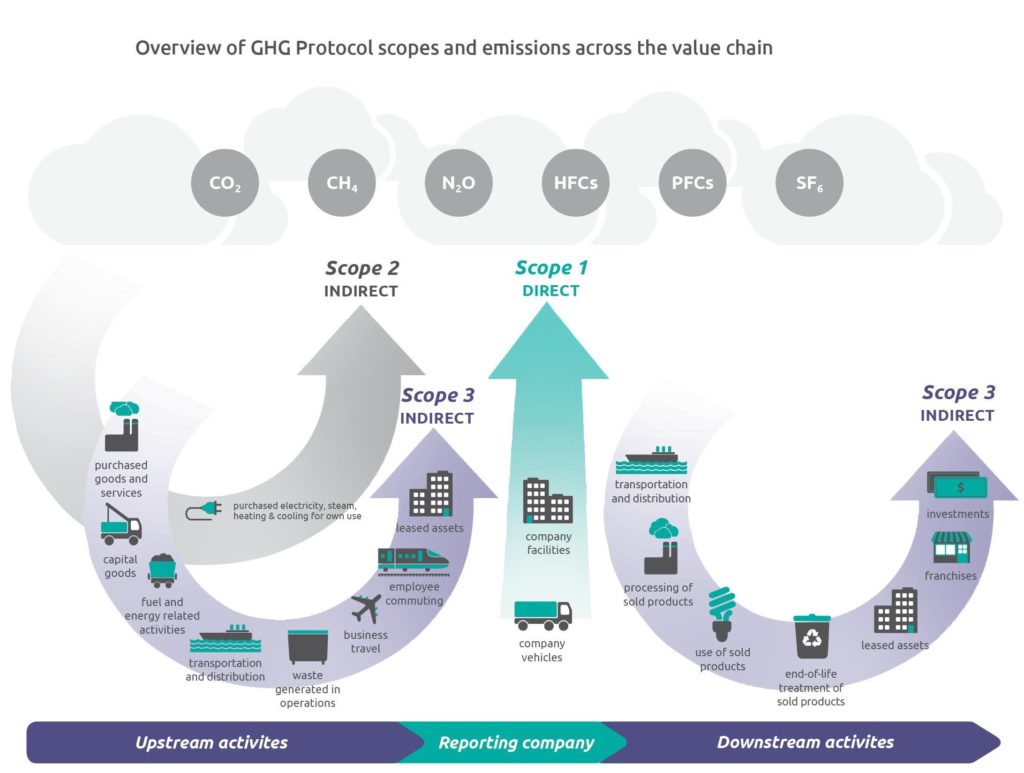
For starters, you should know that the globally recognized Greenhouse Gas Protocol distinguishes three levels, or “scopes,” at which a company emits CO2:
- Scope 1: direct CO2 emissions from sources in the organization, such as in buildings, factories and vehicles. Consider the burning of gas to heat premises.
- Scope 2: indirect CO2 emissions from purchased electricity or heat. Consider the CO2 released in the generation of the electricity you consume.
- Scope 3: indirect emissions of CO2 from business activities of other organizations you work with. Think suppliers, waste processors and investors.
In this article, we limit ourselves to calculating scope 1 and 2 emissions. Your scope 1 and 2 emissions are fairly easy to calculate, and also the easiest to reduce. So start here. By the way, this does not mean that scope 3 is unimportant. On average, 80% of the CO2 emissions needed to deliver a product are in an organization’s value chain . In sectors such as retail and construction, this is precisely where the most profit can be made! Read our extensive article on how to map scope 3 emissions to take the next step in your CO2 measurement.
Mapping your carbon footprint in 6 steps
Measuring your carbon footprint is done systematically in 6 practical steps. From identifying your emission sources to reporting results and identifying improvement opportunities. Follow this approach and you’ll have a clear baseline of your business within weeks.
Step 1. Identify sources of emissions.
The first step in calculating total emissions is to determine the sources of CO2. This varies by sector and, of course, depends on business processes. For factories, CO2 emissions are often already defined in an emissions plan. For offices and stores, consider the consumption of gas and electricity for the premises, fuel for cars and other vehicles, and refrigerants for air conditioners.
Sources by sector:
- Office organizations: energy consumption of buildings and leased cars
- Retail companies: refrigeration and transportation of goods
- Manufacturing companies: process energy and material consumption
Step 2. Find consumption data
Next, for each CO2 source, figure out how much of it you consume. This is usually the trickiest step. Often organizations know how many euros are spent on heating and fuel, but how many cubic meters of gas and how many liters of gasoline are behind it is trickier.
The best data sources are:
- Energy bills (for exact m³ gas and kWh electricity)
- Tank card data for vehicles
- Supplier invoices for manufacturing processes
If facility manager and finance department work together, this data usually does surface. A practical tip: start with the largest cost items, because that’s often where 80% of your total emissions are.
Step 3. Estimate missing data.
Especially the first time, getting a complete overview of all data will be difficult. In that case, you can estimate missing data. For example, if you do not know the exact consumption of the heating system, you can use standard data on consumption per square meter of office. The same applies to car emissions: they can be estimated using the average CO2 emissions per kilometer.
Reliable estimates for Dutch organizations:
- Office buildings: 15-25 m³ of gas per sq. m. per year and 50-150 kWh of electricity per sq. m.
- Transport: 0.18 kg CO2 per km for gasoline cars and 0.16 kg CO2 per km for diesel
- For Dutch office buildings, you can also consider sustainable building guidelines that affect energy consumption. Aim for at least 90% of your total emissions mapped – that’s accurate enough for a good baseline.
Step 4. Calculate CO2 emissions from data
Based on the consumer data, you can now calculate the CO2 emissions per source. By possibly supplementing this with estimated data and then adding it up, you arrive at the company’s total CO2 emissions in scope 1 and 2. To calculate CO2 emissions use websites such as CO2emissiefactoren.nl where you can find accurate consumption figures per unit for a large number of emission sources. The calculation tools of milieubarometer.nl, klimaatplein.com and carbonmanager.nl are also useful tools for this purpose.
The formula for calculating CO2 is simple: Consumption × Emission factor = CO2 emissions.
Dutch emission factors 2025:
- Natural gas: 1.884 kg CO2/m³
- Electricity: 0.372 kg CO2/kWh
- Gasoline: 2.28 kg CO2/liter
- Diesel: 2.67 kg CO2/liter
Calculation example scope 1 and 2:
- Gas consumption: 25,000 m³ × 1.884 = 47.1 tons of CO2
- Electricity: 80,000 kWh × 0.372 = 29.8 tons of CO2
- Leased cars: 40,000 km × 0.18 = 7.2 tons of CO2
Total scope 1+2: 84.1 tons of CO2
Step 5. Measure and report
All found data can now be captured and visualized in a report. That way you have a tangible and clear document containing your carbon footprint that is useful for both internal and external communications. By including the company’s CO2 emissions in relation to the number of FTEs or annual turnover in the report, you get a good reference point for the future.
A good report contains at a minimum:
- Executive summary with key numbers
- Methodology used
- Results in absolute numbers and per FTE or turnover
- Comparison with industry averages where possible
- Clear visualizations that show where the biggest emissions come from
It is also possible to have this report externally certified by a recognized ISO 14064 certification body. This, by the way, requires that you report according to the quality guidelines of ISO 14064. Not mandatory for small companies, but it will make your report more credible and convincing!
Step 6. Spot opportunities and get to work on sustainability!
The report containing a detailed description of your CO2 emissions provides a good basis to start doing what it is really all about: reducing your carbon footprint. To spot opportunities, you can compare your CO2 emissions per component with industry peers. Does it turn out that you score poorly on a certain component and can you easily improve it? Then start picking these low-hanging fruits.
Quick wins are:
- LED lighting: 50-70% reduction in electricity consumption for lighting
- Smart thermostats: 10-15% gas reduction
- Green energy procurement: 100% scope 2 reduction
- Hybrid leased cars: 30-50% transportation emissions
You can also take a look at the CO2 performance ladder. Here you will find a number of standard steps that any organization can get started with almost immediately.
Frequently Asked Questions
How often should you measure CO2 emissions?
At least annually for trend monitoring and CSRD compliance. Large organizations often do this quarterly or monthly for operational guidance.
What if we don’t have perfect data?
Start with what you have. Estimates based on reliable sources are better than not measuring at all. You can improve data quality as you go along.
Should we measure scope 3 right away as well?
No, start with scope 1 and 2. These are easier to measure and directly influence. For calculating your company’s carbon footprint, we cover scope 3 in detail in our article on how to map scope 3 emissions. There you will learn how to perform the full value chain analysis, including upstream and downstream emissions.
How do we relate to competitors?
Benchmark through industry associations or sector reports. For service providers and office organizations, CO2 emissions vary enormously depending on factors such as mobility and air travel. According to Climate Neutral Group research of 250 service organizations, trade and service organizations average between 1-10 tons of CO2 per FTE:
- 1 ton of CO2 per FTE: locally active organizations with low travel and mobility.
- 3 tons of CO2 per FTE: companies with high automobility but limited air travel.
- 10 tons of CO2 per FTE: international organizations with regular air travel.
From measuring to making an impact
Measuring is only the beginning. The real impact is in creating a reduction plan, integrating CO2 targets into your business strategy, and engaging your value chain. In follow-up articles, we cover climate, scope 3 emissions, CO2 reduction strategies and climate transition plans.
Need help measuring your company’s carbon emissions and optimizing business processes in terms of ESG? Read more about how Empact can help your organization here or contact us directly for a free intake interview.